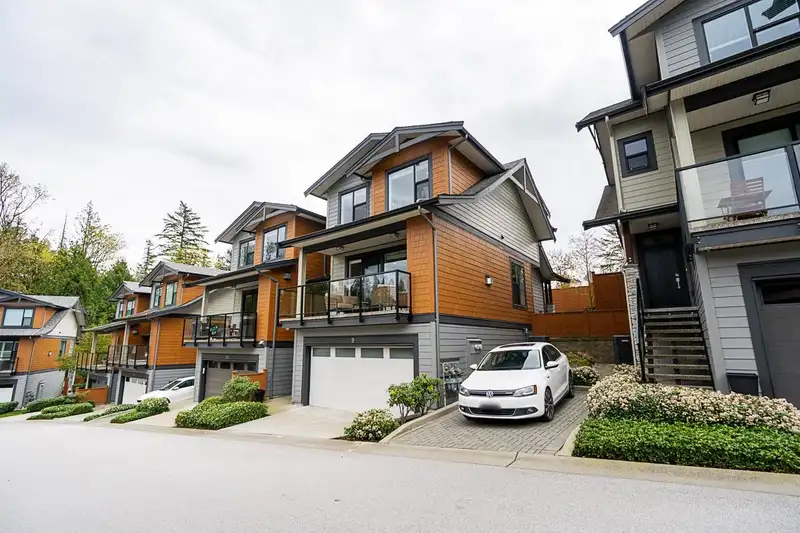
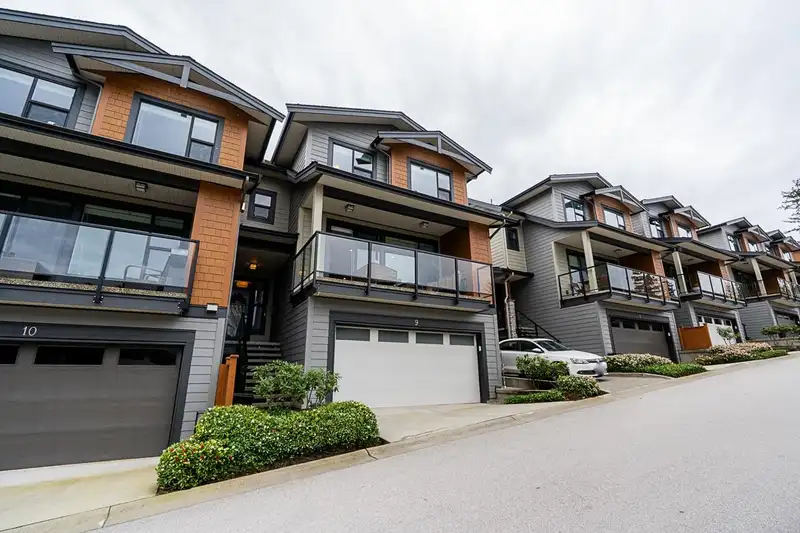
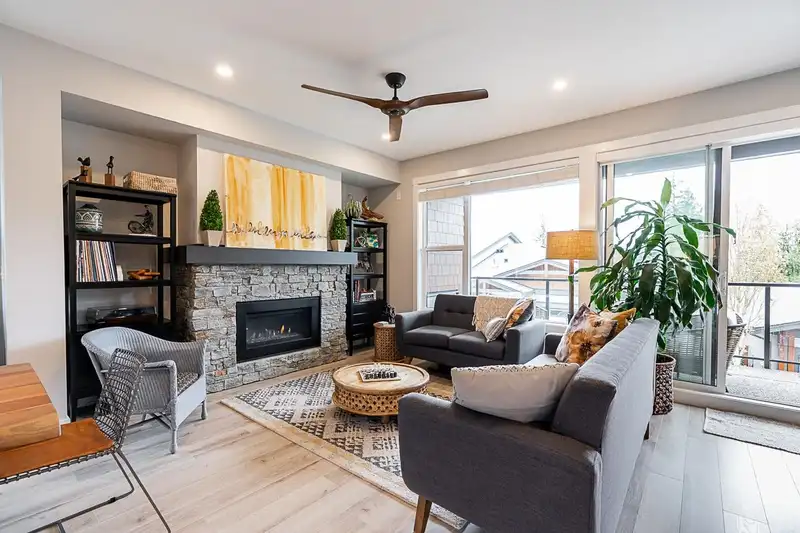
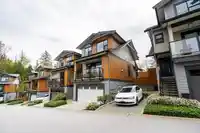
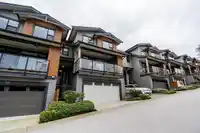
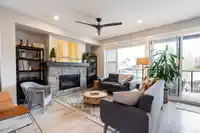
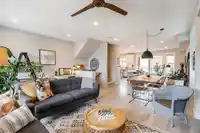
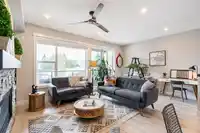
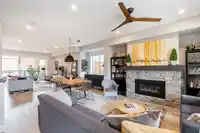
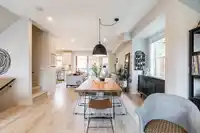
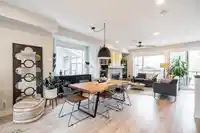
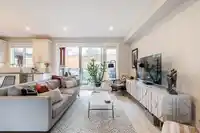
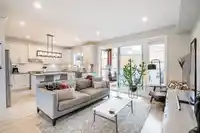
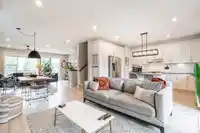
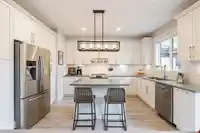
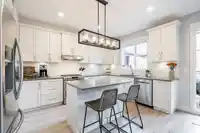
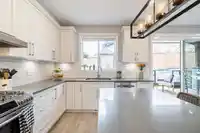
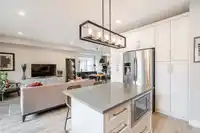
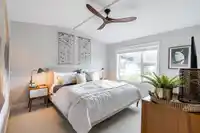
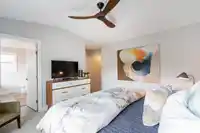
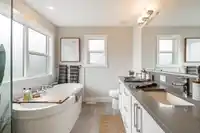
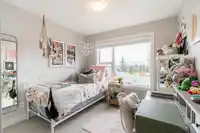
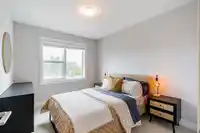
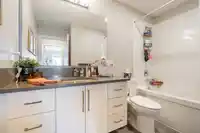
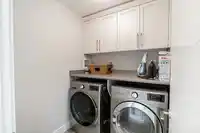
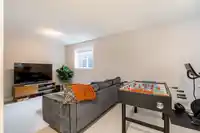
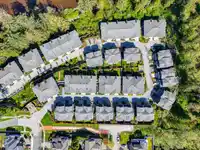
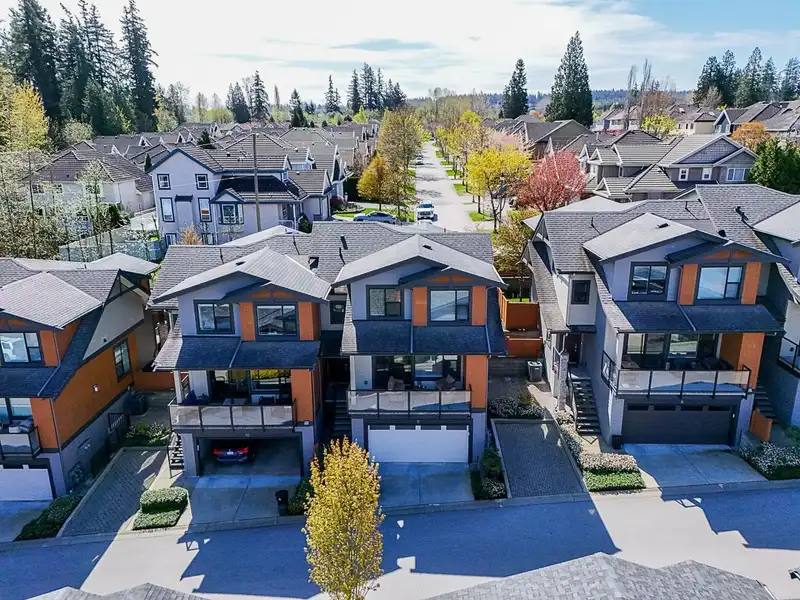
Viridian by Portrait Homes. Gorgeous END UNIT 3 bed/ 4bath 3 level Townhome has everything you need. Second floor primary bedrm has a walk-in closet, along w/ 2 bedrms & laundry rm . Main floor has wideplank laminate flooring w/a gas fireplace in the living rm & dining rm area. Kitchen is bright w/an island, & access to the backyard deck area.…
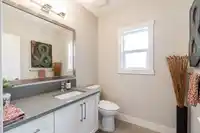
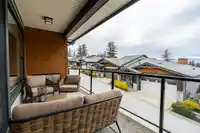
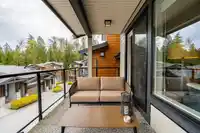
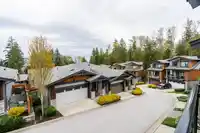
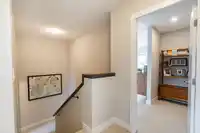
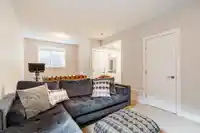
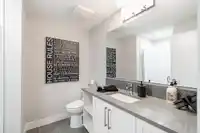
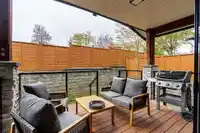
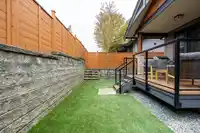
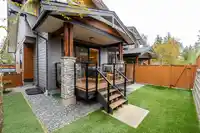
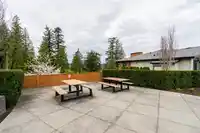
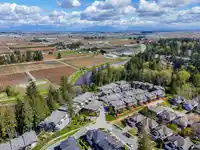
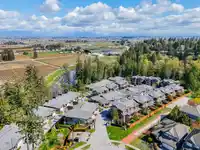
Viridian by Portrait Homes. Gorgeous END UNIT 3 bed/ 4bath 3 level Townhome has everything you need. Second floor primary bedrm has a walk-in closet, along w/ 2 bedrms & laundry rm . Main floor has wideplank laminate flooring w/a gas fireplace in the living rm & dining rm area. Kitchen is bright w/an island, & access to the backyard deck area. Downstairs there is a family rm w/3 piece bathrm. Lots of upgrades in this home: BBQ gas outlet, artificial turf backyard, 2nd deck has composite decking, central vac, security system r/in, Outdr gas fireplace front deck laundry rm counter & cabinets, AC, dining rm light fixture & EV plug with 30 amp breaker. Beautiful Mountain views. Side by Side double garage w/apron parking. Dog park & path to Nicomelkl River within walking distance.
Features
Central Vacuum
Balcony
Garage Double
Front Access
Garage Door Opener
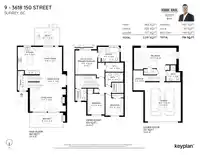
Room measurements12 rooms▸
FoyerMain · 5'4 × 8'1
Living RoomMain · 12'0 × 17'5
Dining RoomMain · 7'10 × 13'11
Family RoomMain · 14'7 × 11'11
KitchenMain · 14'7 × 11'4
Primary BedroomAbove · 12'10 × 11'8
Walk-In ClosetAbove · 4'11 × 9'8
LaundryAbove · 6'2 × 5'7
BedroomAbove · 9'2 × 9'8
BedroomAbove · 11'0 × 9'2
Recreation RoomBsmt · 10'10 × 22'7
StorageBsmt · 10'8 × 6'2
Floor plan
🔍 Tap to zoom
Pinch or scroll to zoom · drag to pan · double-tap to reset

 1 / 40 photos