
 1 / 38 photos






















About This Property
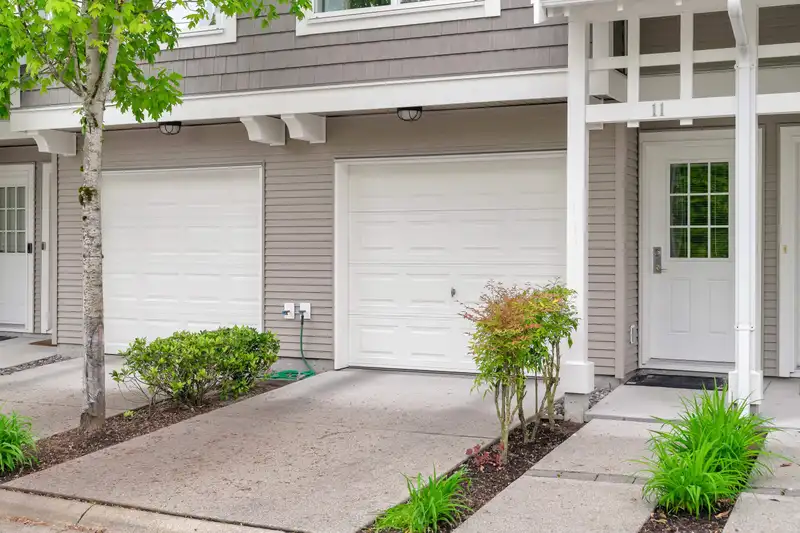
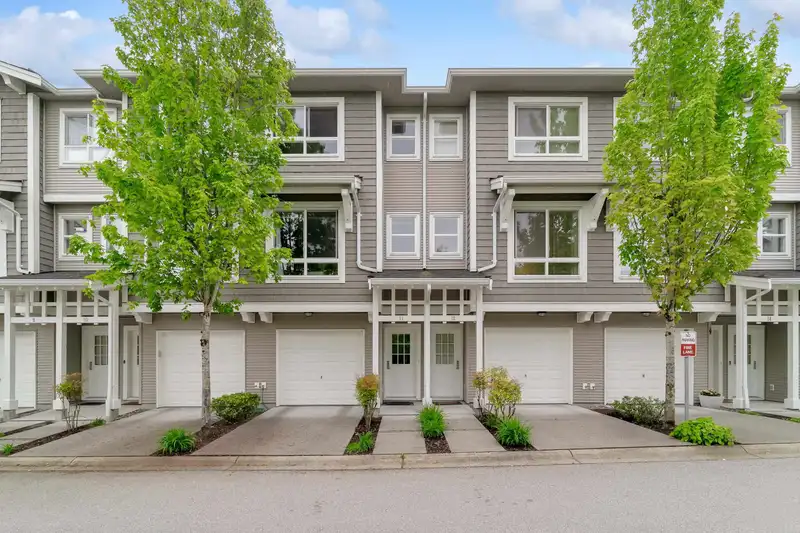
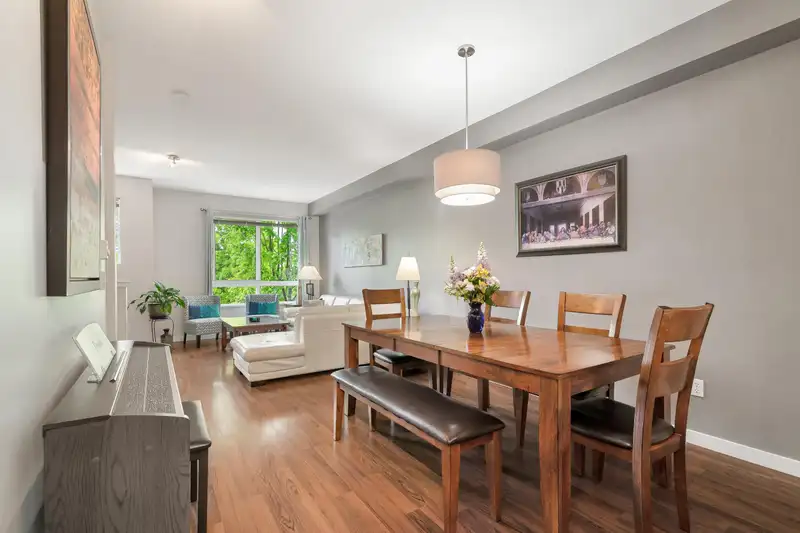
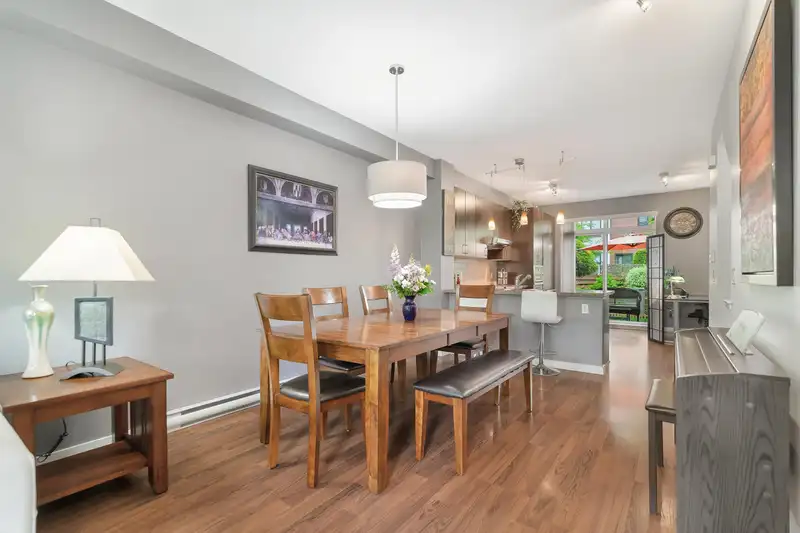
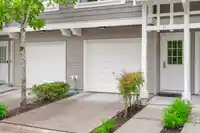
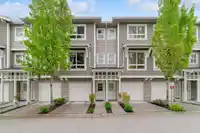
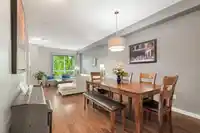
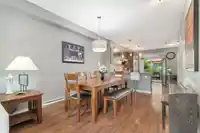
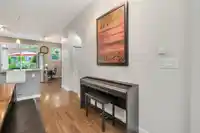
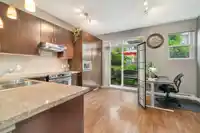
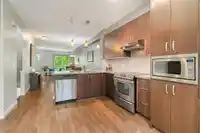
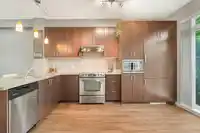
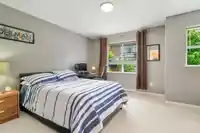
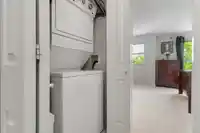
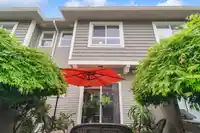
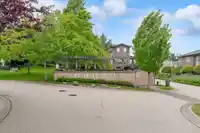
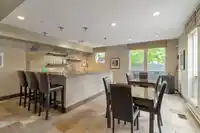
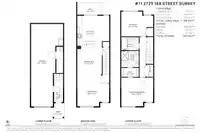
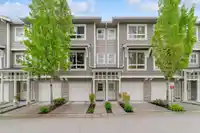
Nestled in the heart of Morgan Crossing, this stylish two-bedroom townhouse blends comfort and convenience seamlessly. Just steps from trendy cafes, restaurants, shops, and fitness centers, you'll enjoy effortless access to everything you love. The well-appointed kitchen boasts stainless steel appliances, granite countertops, and a spacious island…
Features
Property Details
School Catchment
Neighbourhood
Age
- Under 1522%
- 15 to 6466.3%
- 65 and over11.8%
Household size
- 1 person23.2%
- 234.2%
- 319%
- 418.1%
- 5 or more5.4%
Language spoken at home
60.1% English mother tongue
Mother tongue, share of 7,835 residents.
How this pocket differs
- notably fewer 5+ person households than Grandview Surrey 5.4% vs 8.7%
- more people living alone than Grandview Surrey 23.1% vs 17.8%
- fewer Mandarin speakers than Grandview Surrey 13% vs 18%
- Median dwelling value is lower than Metro Vancouver $750,000 vs $1,050,000
Source: Statistics Canada, Census of Population, 2021. Reproduced and distributed on an "as is" basis with the permission of Statistics Canada.
Recent nearby sales
Sold prices are available to registered users. Log in to see what these sold for.
Monthly Cost Calculator
An estimate only. Canadian semi-annual compounding; excludes utilities, closing costs and BC property transfer tax. 5-year fixed, as of Oct 7
Similar Listings Nearby
53 2729 158 STREET
94 2729 158 STREET
90 2729 158 STREET
41 2687 158 STREET
63 15677 28 AVENUE
48 2855 158 STREET
44 15688 28 AVENUE
7 15688 28 AVENUE
23 2855 158 STREET
4 2655 158 STREET
3 2655 158 STREET
7 2655 158 STREET