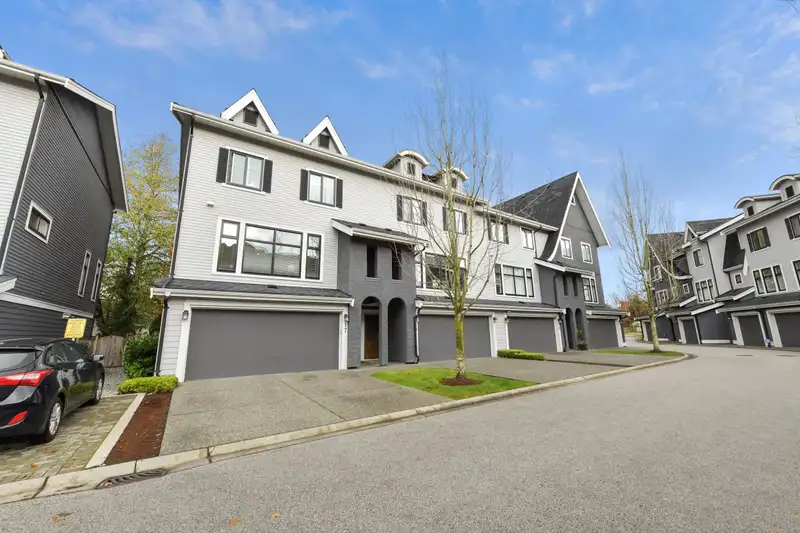
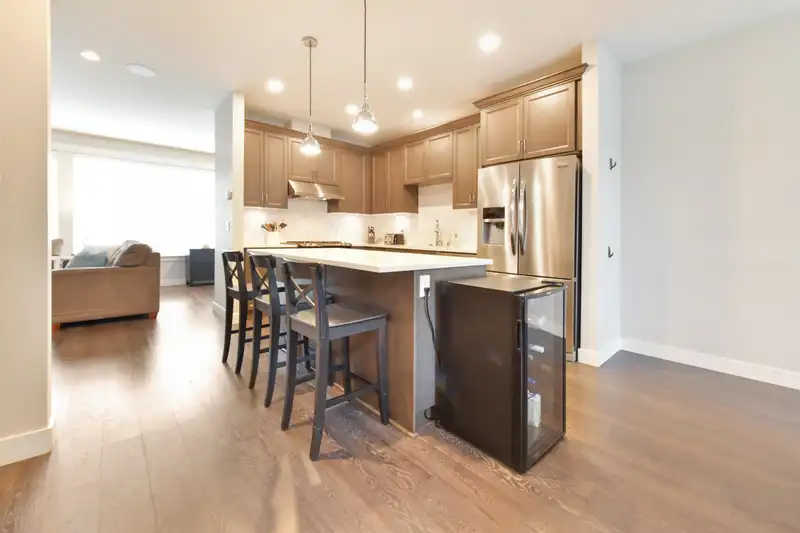
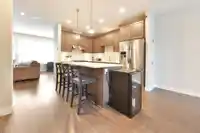
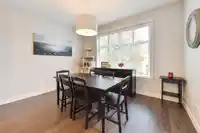
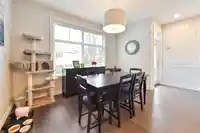
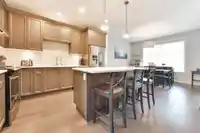
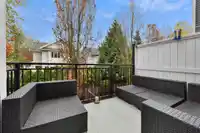
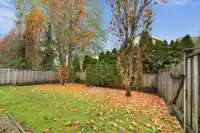
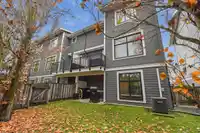
This quiet complex features only 20 unique townhomes nestled in the Rosemary Heights neighbourhood, offering a sense of family and warmth. This originally owned townhome features the main floor with an open-concept, bright chef’s kitchen with upgraded appliances, quartz counter tops. a cozy balcony off the kitchen overlooks a backyard onto peaceful…
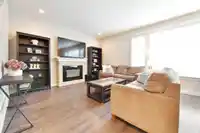
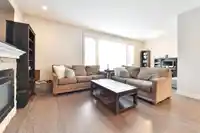
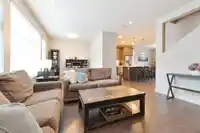
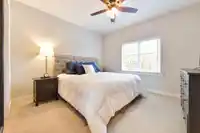
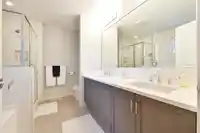
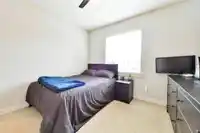
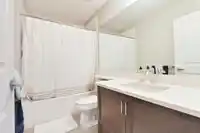
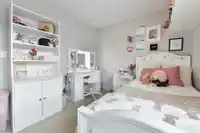
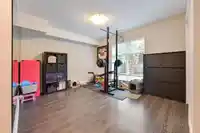
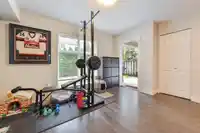
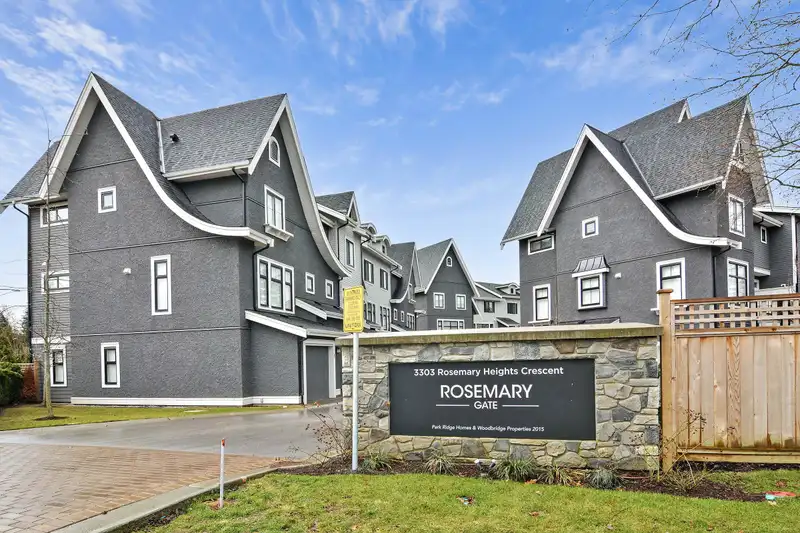
This quiet complex features only 20 unique townhomes nestled in the Rosemary Heights neighbourhood, offering a sense of family and warmth. This originally owned townhome features the main floor with an open-concept, bright chef’s kitchen with upgraded appliances, quartz counter tops. a cozy balcony off the kitchen overlooks a backyard onto peaceful single-family houses. Upstairs features three generously sized bedrooms. The master bedroom includes a large walk-in closet and a spa-like ensuite. The bottom floor offers a sunny, versatile flex room that opens up to the large backyard. The property includes a Double Garage with two additional spots on the private driveway and a fully fenced yard - perfect for your pets. An unbeatable location in South Surrey near schools, shopping & transit.
Features
Garden
Balcony
Private Yard
Additional Parking
Garage Double
Guest
Front Access
Concrete
Garage Door Opener
Shopping Nearby
Room measurements9 rooms▸
Living RoomMain · 14' × 12'
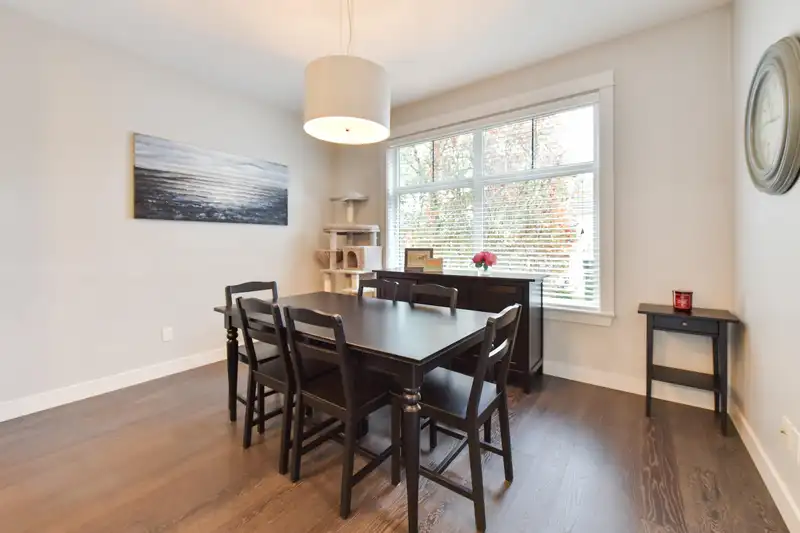
Dining RoomMain · 9' × 10'
KitchenMain · 11'5 × 7'5
Family RoomMain · 11' × 12'
Primary BedroomAbove · 11'5 × 12'
BedroomAbove · 9'5 × 10'
BedroomAbove · 8' × 9'5
Walk-In ClosetAbove · 7' × 6'
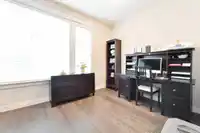
Flex RoomBelow · 10'5 × 12'
Floor plan
🔍 Tap to zoom
Pinch or scroll to zoom · drag to pan · double-tap to reset

 1 / 27 photos